How a Four Elements Process Chart Brings Structure to Business Data Without Overcomplicating Things
Most professionals have experienced the frustration of staring at a dense spreadsheet or a cluttered slide deck, knowing the information is important but struggling to extract a clear story from it. Business data rarely speaks for itself. It needs a frame — a visual structure that guides attention, reveals relationships, and tames complexity without stripping away meaning. Among the tools that accomplish this well, the Four Elements Process Chart stands out for its blend of simplicity and analytical depth. This approach uses four interconnected components to map out a process, system, or decision pathway in a way that feels intuitive rather than technical.
What gives the Four Elements Process Chart its practical edge is not novelty — cyclical and quadrant-based diagrams have been around for decades — but rather the discipline it imposes. By limiting core visual segments to four, it forces the creator to prioritize, synthesize, and clarify. For business data in particular, where noise often drowns out signal, that constraint can be remarkably productive.
What a Four Elements Process Chart Actually Does With Business Data
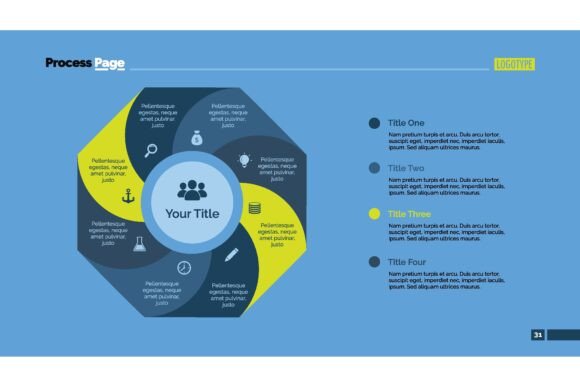
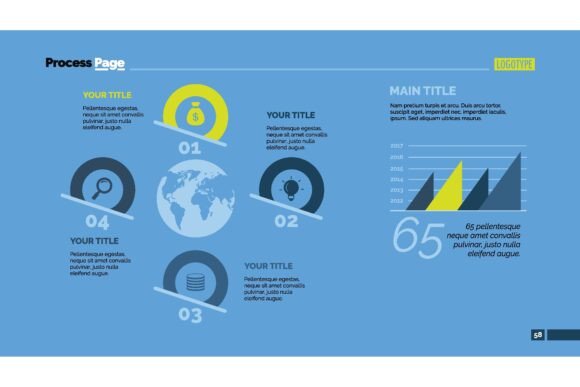
At its most basic level, a Four Elements Process Chart breaks a central concept, workflow, or dataset into four distinct but interrelated parts. These parts are typically arranged in a circular flow, a quadrant grid, or a stepwise sequence depending on the story being told. Each element represents a phase, category, driver, or outcome — and the visual arrangement makes it immediately clear how they connect, overlap, or progress.
In a business context, this might look like mapping the four stages of a customer journey: awareness, consideration, decision, and retention. Or it could illustrate four pillars of a quarterly growth strategy: product development, market expansion, operational efficiency, and talent investment. The versatility comes from the fact that the four-element structure can hold almost any kind of data, as long as it can be organized into meaningful clusters.
What makes this distinct from a generic infographic or flowchart is the intentional limitation. A process chart with seven or ten steps risks overwhelming the viewer. Four elements hit a cognitive sweet spot — enough complexity to be substantive, few enough to be memorable. This is one reason the Four Elements Process Chart has become a go-to format in presentations, strategy documents, and team workshops.
Comparing the Four Elements Approach to Other Visualization Styles
To understand when a Four Elements Process Chart is the right choice, it helps to place it alongside other common methods for displaying business data visually. Each option has its own strengths and tradeoffs, and the best choice depends heavily on the nature of the data and the audience.
Linear Flowcharts Versus Element-Based Frameworks
Traditional flowcharts excel at showing sequential steps, decision branches, and conditional logic. If you need to document a compliance process with if-then rules or map a software workflow with multiple decision nodes, a flowchart is hard to beat. However, flowcharts can become unwieldy quickly — what starts as a clean diagram can spiral into a tangled web of arrows and diamond shapes.
A Four Elements Process Chart takes a different approach. Rather than emphasizing every possible path, it focuses on core categories and their relationships. This makes it better suited for high-level strategy communication, where the goal is alignment rather than exhaustive documentation. You lose some granularity, but you gain clarity — and often that tradeoff is worth making when presenting to executives or cross-functional teams who need the big picture first.
Mind Maps and Organic Idea Structures
Mind maps radiate from a central concept and allow for freeform branching. They are excellent for brainstorming sessions, note-taking, and early-stage exploration where ideas are still fluid. There is no fixed number of branches, and the structure can grow organically.
The Four Elements Process Chart is more structured by design. It works best when the data or concept has already been refined to a manageable set of ideas that can be grouped into four cohesive buckets. If a team is still in divergent thinking mode, forcing a four-element framework too early can feel constricting. But once the core themes have emerged, applying this structure can crystallize thinking and make the output more shareable.
Dashboards and Real-Time Data Displays
Operational dashboards serve a different purpose altogether. They are built for monitoring, alerting, and ongoing performance tracking. Metrics update dynamically, and the layout prioritizes at-a-glance status checks over narrative flow.
A Four Elements Process Chart is not a real-time tool. It is a communication artifact — something you create to tell a specific story at a specific moment. While a dashboard might show you that revenue is down this week, a Four Elements Process Chart could explain the four strategic factors contributing to that trend and how they interact. Used together, dashboards provide the pulse while element-based charts provide the diagnosis.
Where This Chart Style Delivers the Most Value
Certain scenarios tend to reward the use of a Four Elements Process Chart more than others. Recognizing these situations can save time and lead to better communication outcomes.
- Strategy rollouts where leadership needs to align departments around a few clear pillars. The constrained format prevents dilution of the core message.
- Client-facing proposals that need to convey depth without overwhelming the reader. Four elements signal competence without complexity.
- Training and onboarding materials where new hires or team members benefit from a memorable framework they can recall later.
- Process improvement initiatives that identify four key levers or phases. The visual symmetry helps stakeholders see the system rather than isolated problems.
- Cross-functional workshops where participants from different disciplines need a shared language to discuss interconnected challenges.
In each of these cases, the value lies not just in displaying business data but in shaping how that data is perceived and discussed. The chart acts as a boundary object — a visual artifact that different people can point to, annotate, and reference in conversation.
Recognizing the Limitations Before You Commit
No visual framework is universally appropriate, and the Four Elements Process Chart is no exception. Its greatest strength — the four-part structure — can also become its most significant limitation when applied to the wrong content.
If you find yourself stretching to fit concepts into four buckets, manufacturing a fourth element that feels hollow, or collapsing important distinctions to preserve the structure, the format is likely working against you rather than for you. Forcing data into an arbitrary template undermines credibility. An audience that senses contrivance will question not just the chart but the analysis behind it.
Similarly, business data sets that involve nuanced tradeoffs among many variables may resist clean categorization. A pricing optimization problem with fifteen influencing factors, for instance, does not naturally collapse into four neat elements without significant oversimplification. In such cases, alternative approaches like weighted decision matrices, multi-variable scatter plots, or layered drill-down presentations may serve better.
Timing also plays a role. If the underlying analysis is incomplete or the team has not yet agreed on what matters most, a Four Elements Process Chart can prematurely lock in a perspective. Used at the wrong stage, it can short-circuit the critical thinking needed to arrive at the right structure in the first place.
Making an Informed Choice Based on Your Specific Context
Selecting whether to use a Four Elements Process Chart ultimately comes down to a handful of practical considerations. Reflecting on these questions before building the visual can prevent rework and improve the final output.
What is the primary purpose of the communication? If you aim to orient, align, or persuade — and the subject matter naturally clusters into four areas — the format is likely a strong match. If you need to document exhaustive detail or support real-time decision-making, consider other tools.
Who is the audience and what do they need from the data? Senior stakeholders often appreciate the synthesis that a four-element structure provides. Technical specialists may want more granularity than the format allows. Tailor the complexity to the audience rather than defaulting to a single style for all situations.
How mature is the analysis? Early-stage exploration rarely benefits from rigid structures. Later-stage synthesis almost always does. The sweet spot for a Four Elements Process Chart is when the thinking is clear enough to structure but before the communication needs to be finalized.
Will the four categories feel authentic or forced? Authenticity matters. Test the categories with a colleague who knows the content. If they immediately understand the groupings and can explain them back, you have a viable structure. If they push back or suggest splitting or merging elements, listen carefully.
Practical Ways Teams Use This Format Today
Across organizations, the Four Elements Process Chart appears in several recurring patterns. Marketing teams use it to illustrate campaign frameworks — think audience, message, channel, and measurement — giving stakeholders a one-page view of how tactics connect to strategy. Product managers use it to map development phases: discovery, design, build, and launch. Operations leaders adopt it to show continuous improvement cycles, often drawing plan-do-check-act loops that trace naturally through four quadrants.
In each case, the chart does more than organize business data. It creates a shared reference point that reduces the need for repeated explanation. When someone says "we are in phase two of the framework," others in the room who have seen the chart know exactly what that means. This efficiency in communication is one of the quieter but more significant benefits of adopting the format.
The Four Elements Process Chart also integrates well into existing slideware and document templates. Because of its clean geometry, it scales across screen sizes and print formats without losing legibility — a practical advantage that more complex diagrams often sacrifice.
Knowing When to Step Away From the Format
There are moments when even a well-constructed chart needs to be set aside in favor of something else. When the business data reveals messy interdependencies that resist clean separation, when the audience requires granular drill-down capabilities, or when the narrative demands a chronological arc rather than a relational map — these are all signals that another visualization approach may communicate more effectively.
Additionally, cultures that prize rigorous debate and challenge can sometimes perceive elegant frameworks as overly simplistic. In those environments, it may be better to present the underlying data and analysis tables first, introducing a visual synthesis only after the audience has had a chance to interrogate the details. The Four Elements Process Chart then shifts from being the main event to being a helpful summary — a role it performs well without overpromising.
Ultimately, the mark of a thoughtful professional is not loyalty to any single tool but the ability to match the method to the message. The Four Elements Process Chart earns its place in the toolkit because of what it does well: bringing shape to business data, creating conditions for clearer thinking, and producing visuals that audiences can understand and remember. Like any tool, its value depends less on what it can do in theory and more on how it fits the specific challenge at hand.