The Eight Components Process Chart: A Strategic Framework for Clearer Business Decisions
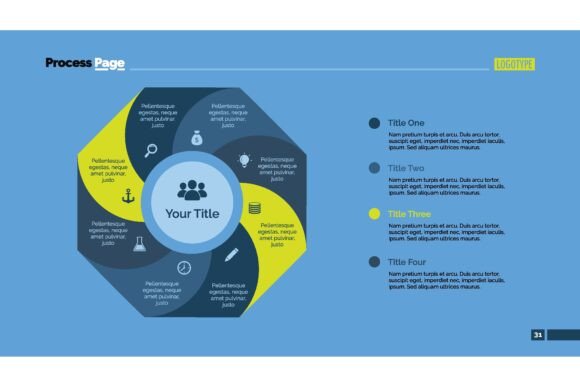
Every business decision, whether launching a campaign or restructuring a team, comes down to how clearly you see the moving parts. When information piles up in dense paragraphs or flat spreadsheets, the connections between priorities get lost. The Eight Components Process Chart changes that. It forces coherence—eight distinct segments that map a process, a strategy, or a system in a way the eye can scan and the mind can retain. Unlike traditional pie charts or linear timelines, this structure acknowledges that business components rarely operate in isolation. They loop, overlap, and influence each other. Presenting them in a unified visual rhythm helps you, your team, and your stakeholders grasp complexity without drowning in it.
What sets this chart apart is its balance of design restraint and informational density. You are not decorating slides; you are engineering clarity. Each component earns its place, demanding you ask the hard question: what truly belongs in the eight slots, and what is noise? That filtering process alone can sharpen a strategy faster than a dozen meetings. Whether you map customer journey stages, operational pillars, or product feature sets, the Eight Components Process Chart turns abstract spreadsheets into a narrative that sticks.
Why Eight? The Psychology Behind the Structure
Memory research consistently shows that the human brain chunks information most efficiently in groups of around seven, plus or minus two. Eight sits comfortably within that cognitive sweet spot—enough components to capture meaningful depth, yet not so many that the viewer disengages. When you present a process with twelve or fifteen stages, attention fractures. With four, you risk oversimplifying critical nuance. Eight gives you room to be thorough while respecting the limits of working memory.
This is not a trivial design choice. A well-constructed Eight Components Process Chart leverages that neurological threshold to keep your audience oriented. In a boardroom or a client presentation, you want decision-makers to internalize the flow, not squint at labels. The round or circular layout—common in these charts—also suggests continuity rather than start-and-stop finality. Processes rarely end cleanly; they feed back into earlier stages. Eight points around a center nod to that reality without needing a complex diagram.
Where This Chart Fits Into Strategic Planning
Strategic planning often suffers from two extremes: either the plan is too vague to guide action, or it becomes so granular that no one remembers the big picture. The Eight Components Process Chart occupies the productive middle. You can use it to translate annual goals into operational pillars, each component representing a strategic focus area—customer retention, talent development, digital transformation, cost optimization, and so on. By visualizing them as interconnected nodes rather than a bulleted list, you signal that progress in one area depends on momentum in others.
For example, a marketing director planning a quarterly brand refresh might map components like audience research, messaging architecture, visual identity, channel strategy, content production, distribution, measurement, and iteration. Seeing them arranged around a central goal—say, "brand relevance in a shifting market"—makes it obvious that delaying audience research will ripple into messaging and measurement. The chart becomes a conversation tool, not just a deliverable. Teams can point to a segment and ask, "What constraints here are blocking progress there?" That kind of cross-functional dialogue rarely emerges from a Gantt chart alone.
Using the Chart to Strengthen Positioning and Brand Clarity
Brand positioning often feels intangible until you force it into a structured visual. An Eight Components Process Chart can articulate how your brand delivers value, with each segment standing for a proof point, audience need, or differentiation vector. Think of it as a signature system—your unique approach broken into eight repeatable elements. A consultancy might frame its methodology this way, showing prospects exactly how discovery leads to analysis, strategy, implementation, and review, with specific sub-steps occupying each wedge.
The visual clarity also benefits internal alignment. When employees in different departments see the brand promise decomposed into tangible components, they are more likely to recognize their role in delivering it. The finance team sees how billing transparency supports the "client partnership" component. The operations team understands that on-time delivery is not just a metric but a visible segment of the brand experience. The chart bridges the gap between high-level positioning statements and daily decisions.
When to Choose This Chart Over Other Visuals
Not every dataset belongs in an eight-component layout. Use it when you need to show how parts form a cohesive whole, when the relationship between components matters as much as the components themselves, or when you want to emphasize balance across priorities. It works exceptionally well in situations where you need to communicate symmetry—eight equally weighted pillars, eight phases of a methodology, or eight core capabilities that collectively define an offering.
Avoid forcing it onto linear, sequential processes that have little interdependence. If your workflow is strictly first-this-then-that with minimal feedback loops, a horizontal flow diagram may serve better. Also be wary of cramming too much text into each segment. The power of the Eight Components Process Chart lies in its visual scannability. If every wedge contains dense paragraphs, you have undermined the very clarity you sought to create. Use concise labels and let the surrounding narrative—your spoken presentation or accompanying report—provide depth.
Practical Steps to Build a Meaningful Eight Components Process Chart
Start with the central concept first. What is the unifying theme or purpose? Write it in the middle—be specific. "Growth" is too vague. "Scaling service delivery without sacrificing response time" gives you a sharper lens. Once the center is clear, brainstorm all possible elements that relate to it. You will likely list twelve or fifteen. Your job is to edit ruthlessly, grouping related ideas until exactly eight distinct components remain. This is where the strategic thinking happens. If you cannot justify why a component earns a standalone segment, merge it or cut it.
Next, consider the arrangement. Are these components sequential, or do they radiate equally? In a circular layout, placement carries meaning. Components placed opposite each other often represent complementary forces—say, efficiency versus innovation, or acquisition versus retention. Adjacent components suggest natural handoffs or affinities. Test your layout with a colleague before finalizing. Ask them what story the chart tells without any verbal explanation. If their answer matches your intent, you have built it well.
Finally, commit to visual consistency. Use the same icon style, the same font weights, the same color logic across all eight segments. Inconsistency whispers disorganization. The Eight Components Process Chart gains authority from polished execution. When a viewer sees that you cared enough to align every element, they assume you bring the same rigor to the thinking behind it.
Real-World Applications Across Business Functions
A financial advisory firm might use the chart to illustrate its client review process: discovery, goal-setting, portfolio construction, risk assessment, tax-efficiency review, implementation, quarterly monitoring, and annual rebalancing. Each component anchors a conversation, giving clients a predictable, transparent view of what to expect. The circular format subtly communicates that the process is ongoing—financial health is not a one-time project.
In product management, an Eight Components Process Chart can define a development philosophy. Components might include user research, competitive analysis, prototyping, usability testing, engineering sprints, accessibility review, launch readiness, and post-launch iteration. Arranged around a central user need, the chart helps product teams avoid the tunnel vision of shipping features in isolation. It reminds them that accessibility is not a final checkbox but a living component that loops back into research.
Educators and trainers find the format useful for curriculum design. Eight modules around a core learning outcome give students a mental map of the journey ahead. Unlike a straight syllabus, the visual suggests interconnections—how module three's concepts will resurface in module seven's case studies. Adult learners, in particular, appreciate knowing how pieces fit together before they dive in.
Supporting Long-Term Decision-Making and Team Alignment
One underappreciated benefit of committing to this format is the alignment it generates over time. When a leadership team agrees on eight strategic components for the fiscal year, those segments become a shared language. Quarterly reviews can be structured around each component, assessing progress, obstacles, and needed adjustments. The chart remains constant even as tactics shift—a stabilizing reference point in a volatile environment.
This consistency also aids onboarding. New hires or new stakeholders can be walked through the chart in minutes, grasping the essential architecture of how your business thinks and operates. That is far more effective than handing over a fifty-page strategy document. The visual encodes priorities. Over months and years, the specific components may evolve, but the discipline of limiting yourself to eight—of curating what matters most—builds a habit of strategic clarity that compounds.
Risks and Common Pitfalls to Watch For
Relying on any framework without context invites superficiality. The Eight Components Process Chart is a tool, not a solution. Using it simply because a template looked attractive leads to charts that look impressive but say nothing. Audiences—especially experienced decision-makers—can quickly distinguish between a chart born of genuine analysis and one filled with buzzwords arranged in a circle. If you cannot defend each component with data, examples, or logic, go back to the drawing board.
Another risk is treating the eight components as fixed when your business reality demands fluidity. Markets shift. Customer needs change. A chart built in January should be open to revision in July. The structure serves you; you do not serve the structure. Some leaders become attached to a particular visualization and resist updating it because the design took hours. That attachment can lead to stagnation, where the team continues referencing components that no longer reflect strategic priorities. Treat the chart as a living document, revisiting it at defined intervals.
Collaborative overload can also creep in. In an effort to get buy-in, teams sometimes dilute the eight components until they are so broad that they lose meaning. Compromise is necessary, but if every stakeholder insists on seeing their department represented explicitly, the chart becomes a political artifact rather than a strategic one. The facilitator building the chart needs the authority—and the courage—to prioritize coherence over universal appeasement.
Integrating the Chart Into Communication and Reporting Workflows
Think beyond the standalone infographic. The Eight Components Process Chart can anchor a monthly performance dashboard, with each segment linked to key metrics. A digital version might allow viewers to click into a component for deeper detail—turning a static visual into an interactive reporting layer. In board presentations, you can reveal components one at a time to guide attention and build toward the full picture, preventing the cognitive overwhelm that comes from displaying everything at once.
For client-facing materials, the chart signals preparedness. When a prospect sees their challenges organized into eight thoughtful components, they feel understood. The structure communicates that you have done this before, that you anticipate complexity and have a system for handling it. That confidence is invaluable in competitive pitches where trust forms quickly. The chart also gives the client a framework to sell your approach internally, using the visual to explain to their own colleagues why the investment makes sense.
Choosing the Right Context for Maximum Impact
Reserve the Eight Components Process Chart for moments when you genuinely need to illuminate structure. Deploying it too often dilutes its effect. Use it to frame annual strategies, major product launches, organizational redesigns, or signature methodologies. Use it when the cost of misunderstanding is high—when a misaligned team or a confused client could result in lost revenue or wasted resources. In those high-stakes scenarios, the chart earns its place, cutting through noise and anchoring decisions in a shared visual truth.
In lower-stakes or highly detailed operational discussions, simpler formats may actually serve better. Not every weekly status update needs a strategic framework. The discipline is knowing when the clarity that eight well-chosen components provide justifies the effort of crafting them. That discernment separates thoughtful practitioners from those who simply reach for the same template every time. Strategy is as much about what you choose not to visualize as what you do.
Making the Practice a Strategic Habit
Adopting the Eight Components Process Chart as a recurring thinking tool yields benefits beyond any single presentation. The mental habit of distilling complexity into exactly eight components trains you to see patterns, to prioritize, and to communicate with economy. Over time, you begin to notice that many business challenges—whether building a marketing plan or diagnosing an operational bottleneck—lend themselves to this structure. The framework becomes a lens, not just a layout.
The most effective practitioners use the chart iteratively. They sketch a rough version on a whiteboard first, testing whether the components hold together before investing in polished design. They share drafts with a few trusted colleagues, observing where questions arise. They refine labels until each one is precise and distinct from the others. They resist the urge to add a ninth component, even when one seems tempting, because the constraint itself generates clarity. Then they design with intention, knowing the strategic work has already been done.
In a business environment saturated with data and starved for wisdom, the ability to present eight clear, connected ideas in one coherent visual is a genuine professional advantage. The Eight Components Process Chart offers that advantage, provided you approach it as a thinking discipline first and a design project second. Stay grounded in the real needs of your audience. Let the chart serve the strategy, not the other way around. When you do that, the visual becomes more than informative—it becomes memorable, persuasive, and actionable. That is the standard worth aiming for every time you open a blank canvas and decide what truly belongs at the center.